26 Jun 2026
Decoding Recovery Timelines: How Schedule Density Reshapes Projections in Multi-Event Seasons
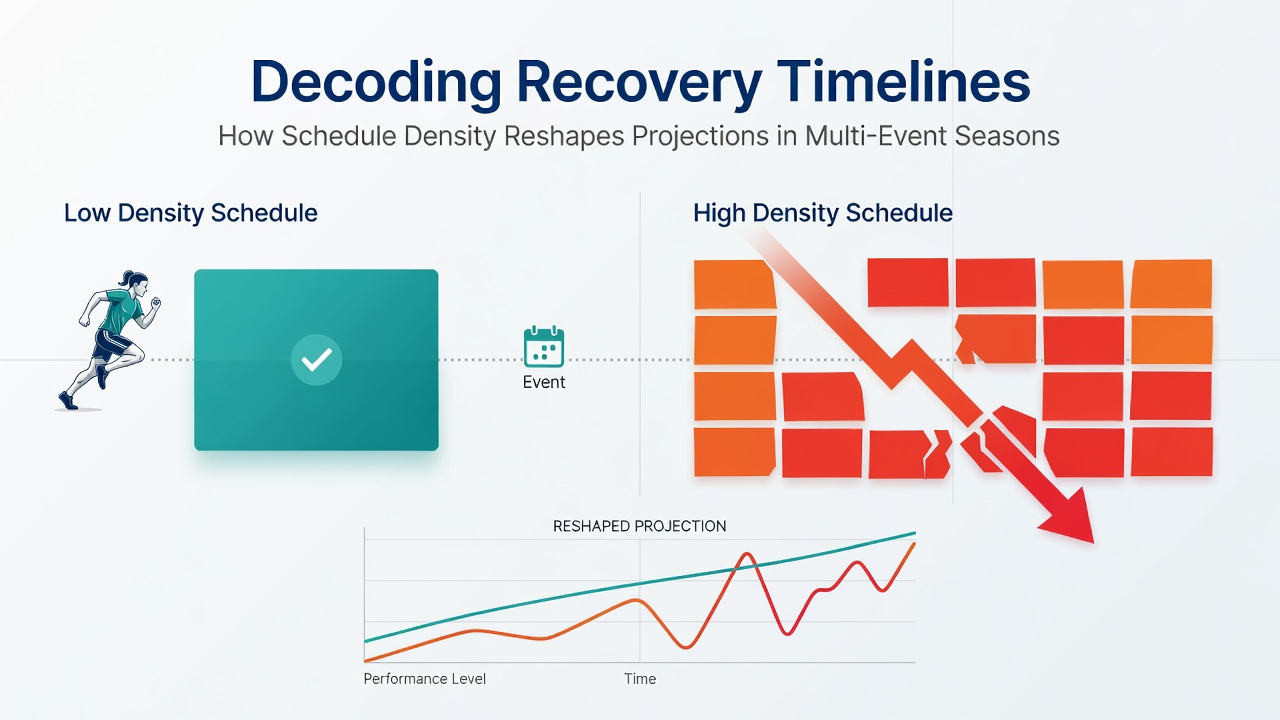
Multi-event seasons place athletes under intense pressure where consecutive competitions leave little room for full physical restoration, and schedule density directly alters performance expectations in sports ranging from tennis tours to basketball leagues and cricket calendars. Researchers track how back-to-back fixtures compress rest periods, forcing adjustments in training loads and medical protocols that reshape outcome forecasts issued by analysts and betting markets alike.
The Mechanics of Schedule Density Across Disciplines
Schedule density refers to the clustering of high-intensity events within short timeframes, a pattern observers note in professional tennis where players may contest multiple tournaments across continents within weeks, while basketball schedules pack regular-season games alongside playoff pushes. In cricket, Test series often overlap with limited-overs formats during summer blocks, creating cumulative fatigue that data from performance tracking systems records as reduced sprint speeds and slower reaction times. Those who've studied elite calendars point out that June 2026 features several overlapping international windows in Europe and Australia, where athletes juggle national duties with club commitments and thereby extend recovery demands beyond standard off-days.
Recovery Timelines and Physiological Markers
Recovery timelines hinge on measurable factors including muscle glycogen replenishment, which typically requires 24 to 48 hours after prolonged exertion, and sleep architecture that suffers when travel crosses time zones. Studies conducted at institutions such as the Australian Institute of Sport reveal that athletes facing fewer than three full rest days between matches show elevated cortisol levels and diminished neuromuscular output, patterns confirmed through wearable sensor data collected across multiple seasons. When density increases, practitioners adjust projections by factoring in these biomarkers, shifting expected win probabilities in head-to-head matchups where one competitor enters with shorter turnaround.
How Projections Adapt to Compressed Calendars
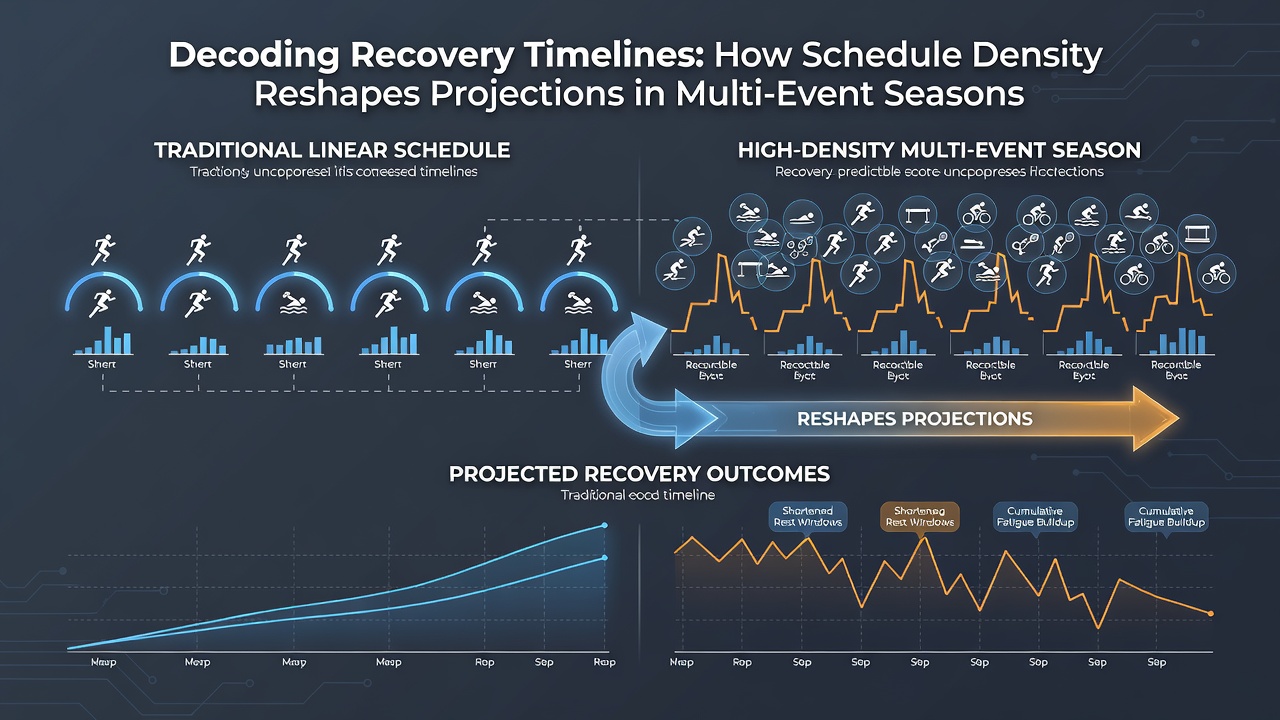
Performance models incorporate recovery variables through algorithms that weigh historical data against current fixture lists, producing revised forecasts when an athlete's recent workload exceeds established thresholds. In basketball, for instance, back-to-back games correlate with lower three-point percentages according to league-wide tracking, prompting analysts to recalibrate totals and spreads accordingly. Tennis statisticians apply similar logic during clay-court swings where surface changes compound physical stress, while cricket analysts adjust run-rate expectations after players complete multi-format tours with minimal breaks. The reality is that these recalibrations draw on longitudinal datasets rather than isolated incidents, allowing for more precise seasonal outlooks.
Regional Approaches to Managing Density Effects
European basketball federations coordinate with clubs to insert mandatory rest protocols during dense winter periods, whereas North American leagues experiment with load-management policies that limit minutes for veteran players. Observers note parallel efforts in Australian cricket where rotation policies aim to preserve bowler workloads across international and domestic fixtures. Data compiled by the NCAA in the United States further indicates that student-athletes in high-density conference schedules experience measurable declines in academic performance alongside athletic output, prompting broader conversations about calendar design. These regional variations feed into global projection systems that blend local rules with universal physiological principles.
Practical Examples from Recent Campaigns
One documented case involved a European basketball side that navigated a condensed EuroLeague and domestic league slate in early 2025, resulting in measurable drops in defensive efficiency after three consecutive away games without recovery days. In tennis, players who reached multiple finals during the 2025 clay season often posted lower first-serve percentages in subsequent grass-court events, trends captured in match-log databases. Cricket teams balancing IPL commitments with national tours have seen spin bowlers report higher injury rates when rest intervals shrink below five days, statistics published in sports medicine journals. Such instances illustrate how schedule density prompts iterative updates to pre-season and in-season forecasts rather than static predictions.
Conclusion
Schedule density continues to influence recovery timelines across multi-event seasons, compelling those who build performance projections to integrate physiological data, travel logs, and fixture clustering into their calculations. As calendars evolve toward 2026 and beyond, the interplay between event volume and restoration windows remains a central variable tracked by analysts seeking accurate assessments of competitive outcomes.